User Guide
Installation
graphviz provides a simple pure-Python interface for the Graphviz graph-drawing software. It runs under Python 3.9+. To install it with pip, run the following:
$ pip install graphviz
For a system-wide install, this typically requires administrator access. For an
isolated install, you can run the same inside a venv or a virtualenv.
The only dependency is a working installation of Graphviz (download page, archived versions, installation procedure for Windows).
After installing Graphviz, make sure that its bin/ subdirectory containing
the dot layout command for rendering graph descriptions
is on your systems’ PATH
(sometimes done by the installer;
setting PATH
on Linux,
Mac,
and Windows):
On the command-line, dot -V should print the version of your Graphiz installation.
Platform: Windows
Windows users might want to check the status of known issues (gvedit.exe, sfdp, commands) and consider trying an older archived version as a workaround (e.g. graphviz-2.38.msi).
Platform: Anaconda
See the downstream conda-forge distribution
conda-forge/python-graphviz
(feedstock),
which should automatically conda install
conda-forge/graphviz
(feedstock) as dependency.
Basic usage
The graphviz package provides two main classes: graphviz.Graph
and graphviz.Digraph. They create graph descriptions in the DOT language for
undirected and directed graphs respectively.
They have the same API.
Create a graph by instantiating a new Graph or
Digraph object:
>>> import graphviz

>>> dot = graphviz.Digraph('round-table', comment='The Round Table')

>>> dot
<graphviz.graphs.Digraph object at 0x...>
Their constructors allow to set the graph’s name identifier,
the filename for the DOT source and the rendered graph,
an optional comment for the first source code line, etc.
Add nodes and edges to the graph object using its node()
and edge() or edges() methods:
>>> dot.node('A', 'King Arthur')
>>> dot.node('B', 'Sir Bedevere the Wise')
>>> dot.node('L', 'Sir Lancelot the Brave')

>>> dot.edges(['AB', 'AL'])
>>> dot.edge('B', 'L', constraint='false')
The node() method takes a name identifier as first argument
and an optional label.
The edge() method takes the names of start node and end node,
while edges() takes an iterable of name pairs.
Keyword arguments are turned into (node and edge) attributes
(see extensive Graphviz docs on available attributes).
Check the generated DOT source code:
>>> print(dot.source)
// The Round Table
digraph "round-table" {
    A [label="King Arthur"]
    B [label="Sir Bedevere the Wise"]
    L [label="Sir Lancelot the Brave"]
    A -> B
    A -> L
    B -> L [constraint=false]
}
Use the render() method to save the DOT source code
and render it with the default dot layout engine
(see below for using other layout engines).
Attention
Skip/ignore any doctest_mark_exe() lines in documentation code examples.
>>> doctest_mark_exe()  # skip this line

>>> dot.render(directory='doctest-output').replace('\\', '/')
'doctest-output/round-table.gv.pdf'
Passing view=True will automatically open the resulting (PDF, SVG, PNG,
etc.) file with your system’s default viewer application
for the rendered file type.
>>> doctest_mark_exe()  # skip this line

>>> dot.render(directory='doctest-output', view=True)
'doctest-output/round-table.gv.pdf'

Attention
Backslash-escapes and strings of the form <...>
have a special meaning in the DOT language
and are currently passed on as is by this library.
If you need to render arbitrary strings literally (e.g. from user input),
consider wrapping them with the graphviz.escape() function first.
See the sections on Backslash escapes
and Quoting and HTML-like labels below for details.
Formats
To use a different output file format than the default PDF,
you can use the format argument when creating your Graph
or Digraph object:
>>> import graphviz

>>> g = graphviz.Graph(format='png')
You can also change the format attribute on an existing graph
object:
>>> doctest_mark_exe()  # skip this line

>>> dot = graphviz.Digraph('hello')
>>> dot.edge('hello', 'world')
>>> dot.format = 'svg'

>>> dot.render(directory='doctest-output').replace('\\', '/')
'doctest-output/hello.gv.svg'
Piped output
To directly access the raw results from the Graphviz dot
layout command as binary bytes
or as decoded str (for plain-text formats like SVG)
instead of writing to a file, use the pipe() method
of your Graph or Digraph object:
>>> import graphviz

>>> h = graphviz.Graph('hello', format='svg')

>>> h.edge('Hello', 'World')
>>> doctest_mark_exe()  # skip this line

>>> h.pipe(format='pdf')[:4]
b'%PDF'

>>> print(h.pipe(encoding='utf-8'))
<?xml version="1.0" encoding="UTF-8" standalone="no"?>
<!DOCTYPE svg
...
</svg>
Tip
Because pipe() returns the raw stdout
from the layout subprocess by default (bytes),
you usually want to decode the return value
when piping into formats like 'svg', 'svg_inline' or 'plain',
e.g. by passing encoding='utf-8'.
Caution
The output for pipe() is buffered in memory,
so avoid this method if the data size is large.
Jupyter notebooks
Graph and Digraph objects have a
_repr_mimebundle_() method so they can be rendered and displayed
directly inside a Jupyter notebook.
For an example, check the examples/graphviz-notebook.ipynb file
in the source repository/distribution
(or the same notebook in nbviewer).
This also allows direct displaying within the Jupyter Qt Console (also the one inside Spyder IDE):
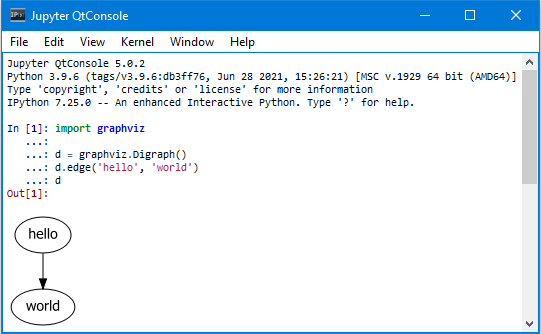
By default _repr_mimebundle_() uses 'svg' format.
You can use the graphviz.set_jupyter_format() to override the default format
that is used for displaying in IPython/Jupyter.
(example,
nbviewer).
Hint
You can also use display_svg(), display_png(), or .display_jpeg()
from IPython.display to display the rendered
Graph or Digraph as SVG, PNG or JPEG
in IPython/Jupyter.
Styling
Use the graph_attr, node_attr, and edge_attr arguments
of the Graph and Digraph constructors to change
the default attributes for your graph, nodes, and edges.
>>> import graphviz

>>> ps = graphviz.Digraph('pet-shop', node_attr={'shape': 'plaintext'})

>>> ps.node('parrot')
>>> ps.node('dead')
>>> ps.edge('parrot', 'dead')
After creation, the graph_attr, node_attr, and
edge_attr attributes be edited on instances:
>>> ps.graph_attr['rankdir'] = 'LR'
>>> ps.edge_attr.update(arrowhead='vee', arrowsize='2')

>>> print(ps.source)
digraph "pet-shop" {
    graph [rankdir=LR]
    node [shape=plaintext]
    edge [arrowhead=vee arrowsize=2]
    parrot
    dead
    parrot -> dead
}

Attributes
To directly add DOT att_stmt attribute statements,
call the attr() method
of the Graph or Digraph instance
with the wanted target as first argument and the attributes as keyword args.
Hint
Attribute statements affect all later graphs, nodes, or edges within the same (sub-)graph.
>>> import graphviz

>>> ni = graphviz.Graph('ni')

>>> ni.attr('node', shape='rarrow')
>>> ni.node('1', 'Ni!')
>>> ni.node('2', 'Ni!')

>>> ni.node('3', 'Ni!', shape='egg')

>>> ni.attr('node', shape='star')
>>> ni.node('4', 'Ni!')
>>> ni.node('5', 'Ni!')
If you omit the first attr() argument, the method can be used
to set arbitrary attributes as key-value pairs targeting
the current (sub-)graph
(e.g. for rankdir, label,
or setting rank='same' within a subgraph context,
example):
>>> ni.attr(rankdir='LR')

>>> ni.edges(['12', '23', '34', '45'])

>>> print(ni.source)
graph ni {
    node [shape=rarrow]
    1 [label="Ni!"]
    2 [label="Ni!"]
    3 [label="Ni!" shape=egg]
    node [shape=star]
    4 [label="Ni!"]
    5 [label="Ni!"]
    rankdir=LR
    1 -- 2
    2 -- 3
    3 -- 4
    4 -- 5
}

Node ports & compass
The edge() and edges() methods use the
colon-separated node[:port[:compass]] format
for tail and head nodes.
This allows to specify an optional node port
plus an optional compass point the edge should aim at
for the given tail or head node (example).
Caution
As colons are used to indicate port and compass for edges,
node names containing one or more literal colons :
are currently not supported.
GH #54
Tip
There is no such restriction for the label argument,
so you can work around by choosing a colon-free name
together with the wanted label as demonstrated below
>>> import graphviz

>>> cpp = graphviz.Digraph('C++')

>>> cpp.node('A', 'std::string')
>>> cpp.node('B', '"spam"')

>>> cpp.edge('A', 'B')

>>> print(cpp.source)
digraph "C++" {
    A [label="std::string"]
    B [label="\"spam\""]
    A -> B
}
Backslash escapes
The Graphviz layout engines support a number of
escape sequences such as \n, \l, \r
(for placement of multi-line labels:
centered, left-justified, right-justified)
and \N, \G, \L
(expanded to the current node name, graph name, object label).
To be able to use them from this library (e.g., for labels),
backslashes in strings are (mostly) passed on as is.
Attention
This means that literal backslashes need to be escaped (doubled) by the user.
As the backslash is also special in Python string literals
a second level of doubling is needed.
E.g. label='\\\\' for a label that is rendered as single literal backlash: \.
Tip
Doubling of backslashes can be avoided by using raw string literals
(r'...') instead.
This is similar to the solution proposed for the stdlib re module.
See also https://en.wikipedia.org/wiki/Leaning_toothpick_syndrome.
>>> import graphviz

>>> e = graphviz.Digraph('escapes')

>>> e.node('backslash', label=r'\\')
>>> e.node('multi_line', label=r'centered\nleft\lright\r')

>>> print(e.source)
digraph escapes {
    backslash [label="\\"]
    multi_line [label="centered\nleft\lright\r"]
}

To disable any special character meaning in a string
(e.g. from user input to be rendered literally),
use the graphviz.escape() function
(similar to the re.escape() function):
>>> bs = graphviz.Digraph('literal_backslash')

>>> bs.node(graphviz.escape('\\'))

>>> print(bs.source)
digraph literal_backslash {
    "\\"
}
>>> doctest_mark_exe()  # skip this line

>>> bs.render(format='svg', directory='doctest-output').replace('\\', '/')
'doctest-output/literal_backslash.gv.svg'

Historical note
To prevent breaking the internal quoting mechanism, the special meaning
of \" as a backslash-escaped quote has been disabled
since version 0.14 of this library.
E.g. both label='"' and label='\\"'
now produce the same DOT source [label="\""]
(a label that renders as a literal quote).
See also examples/graphviz-escapes.ipynb
(nbviewer).
Quoting and HTML-like labels
The graph-building methods of Graph and Digraph objects
automatically take care of quoting (and escaping quotes) where needed
(whitespace, keywords, double quotes, etc.):
>>> import graphviz

>>> q = graphviz.Digraph()

>>> q.edge('spam', 'eggs eggs')
>>> q.edge('node', '"here\'s a quote"')

>>> print(q.source)
digraph {
    spam -> "eggs eggs"
    "node" -> "\"here's a quote\""
}
If a string starts with '<' and ends with '>',
it is passed on as is, i.e. without quoting/escaping:
The content between the angle brackets is treated by
the Graphviz layout engine as special HTML string
that can be used for HTML-like labels:
>>> h = graphviz.Graph('html_table')

>>> h.node('tab', label='''<<TABLE>
...  <TR>
...    <TD>left</TD>
...    <TD>right</TD>
...  </TR>
... </TABLE>>''')

For strings that should literally begin with '<' and end with '>',
use the graphviz.nohtml() function to disable the special meaning of angled
parenthesis and apply normal quoting/escaping:
>>> d = graphviz.Digraph('diamond', format='svg')

>>> d.node('diamond', label=graphviz.nohtml('<>'))

>>> print(d.source)
digraph diamond {
    diamond [label="<>"]
}
>>> doctest_mark_exe()  # skip this line

>>> d.render(directory='doctest-output').replace('\\', '/')
'doctest-output/diamond.gv.svg'

Historical note
Before version 0.8.2,
the only workaround was to add leading or trailing space
(label=' <>'):
Subgraphs & clusters
Graph and Digraph objects have a
subgraph() method for adding a subgraph to the instance.
There are two ways to use it: Either with a ready-made instance
of the same kind as the only argument (whose content is added as a subgraph)
or omitting the graph argument
(returning a context manager for defining the subgraph content more elegantly
within a with-block).
First option, with graph as the only argument:
>>> import graphviz

>>> p = graphviz.Graph(name='parent')
>>> p.edge('spam', 'eggs')

>>> c = graphviz.Graph(name='child', node_attr={'shape': 'box'})
>>> c.edge('foo', 'bar')

>>> p.subgraph(c)
Second usage, with a with-block (omitting the graph argument):
>>> p = graphviz.Graph('parent')
>>> p.edge('spam', 'eggs')

>>> with p.subgraph(name='child', node_attr={'shape': 'box'}) as c:
...    c.edge('foo', 'bar')
Both produce the same result:
>>> print(p.source)
graph parent {
    spam -- eggs
    subgraph child {
        node [shape=box]
        foo -- bar
    }
}
Tip
If the name of a subgraph begins with 'cluster' (all lowercase),
the layout engine treats it as a special cluster subgraph
(example ).
See the Subgraphs and Clusters section in DOT language.
When subgraph() is used as a context manager,
the new graph instance is created with strict=None
copying the parent graph values for directory,
engine, format, renderer, formatter,
and encoding:
>>> doctest_mark_exe()  # skip this line

>>> p = graphviz.Graph('parent', directory='doctest-output')

>>> with p.subgraph(name='child') as c:
...    c.edge('bacon', 'eggs')
...    c.render().replace('\\', '/')
'doctest-output/child.gv.pdf'
Note
These copied attributes are only relevant for rendering the subgraph
independently (i.e. as a stand-alone graph) from within the with-block.
Engines
To use a different layout engine than the default dot
when rendering your graph, you can use the engine argument
on the constructor of Graph or Digraph.
>>> import graphviz

>>> g = graphviz.Graph(engine='neato')
You can also change the engine attribute
on an existing instance:
>>> g.engine = 'circo'
neato no-op flag
The neato layout engine supports an additional rendering flag that allows more control over the node positioning and the edge layout via the pos, overlap, and splines attributes.
Use the neato_no_op keyword argument of
render() or pipe()
to pass it to the layout command:
>>> doctest_mark_exe()  # skip this line

>>> import graphviz

>>> n = graphviz.Digraph(name='splines', engine='neato',
...                      graph_attr={'splines': 'true'},
...                      node_attr={'shape': 'point'})
>>> n.node('a', pos='0,0!', color='blue')
>>> n.node('b', pos='100,0!', color='green')
>>> n.node('c', pos='50,50!', color='red')
>>> n.edge('a', 'b', pos='0,0 30,66 70,60 100,0')
>>> n.render(neato_no_op=2, directory='doctest-output').replace('\\', '/')
'doctest-output/splines.gv.pdf'

Unflatten
To preprocess the DOT source of a Graph or Digraph with
the unflatten preprocessor
(manpage, PDF),
use the unflatten() method.
>>> import graphviz

>>> w = graphviz.Digraph('wide')

>>> w.edges(('0', str(i)) for i in range(1, 10))
>>> doctest_mark_exe()  # skip this line

>>> w.view()

Hint
unflatten() improves the aspect ratio of graphs
with many leaves or disconnected nodes.
>>> u = w.unflatten(stagger=3)
>>> doctest_mark_exe()  # skip this line

>>> u.view()

The method returns a Source object
that you can render(), view(), etc.
with the same basic API as Graph or Digraph objects
(minus modification, see details below).
>>> u = w.unflatten(stagger=2)
>>> u
<graphviz.sources.Source object at 0x...>
>>> doctest_mark_exe()  # skip this line

>>> u.view()

Custom DOT statements
To add arbitrary statements to the created DOT source, you can use the
body attribute of Graph and Digraph objects.
It holds the verbatim list of (str) lines to be written to the source file
(including their final newline).
Use its append() or extend() method:
>>> import graphviz

>>> rt = graphviz.Digraph(comment='The Round Table')

>>> rt.body.append('\t"King Arthur" -> {\n\t\t"Sir Bedevere", "Sir Lancelot"\n\t}\n')
>>> rt.edge('Sir Bedevere', 'Sir Lancelot', constraint='false')

>>> print(rt.source)
// The Round Table
digraph {
    "King Arthur" -> {
        "Sir Bedevere", "Sir Lancelot"
    }
    "Sir Bedevere" -> "Sir Lancelot" [constraint=false]
}
Attention
Note that you might need to correctly quote/escape identifiers and strings containing whitespace or other special characters when using this method.
Using raw DOT
To render a ready-made DOT source code string
(instead of assembling one with the higher-level interface
of Graph or Digraph),
create a graphviz.Source object holding your DOT string:
>>> import graphviz

>>> src = graphviz.Source('digraph "the holy hand grenade" { rankdir=LR; 1 -> 2 -> 3 -> lob }')

>>> src
<graphviz.sources.Source object at 0x...>
Use the render() method to save and render it:
>>> doctest_mark_exe()  # skip this line

>>> src.render('doctest-output/holy-grenade.gv').replace('\\', '/')
'doctest-output/holy-grenade.gv.pdf'
>>> doctest_mark_exe()  # skip this line

>>> src.render('doctest-output/holy-grenade.gv', view=True).replace('\\', '/')
'doctest-output/holy-grenade.gv.pdf'

Existing files
To directly render an existing DOT source file (e.g. created with other tools),
you can use the graphviz.render() function.
>>> doctest_mark_exe()  # skip this line

>>> import pathlib
>>> import graphviz

>>> src = 'digraph "the holy hand grenade" { rankdir=LR; 1 -> 2 -> 3 -> lob }'
>>> filepath = pathlib.Path('doctest-output/the-holy-hand-grenade.gv')
>>> filepath.write_text(src, encoding='ascii')
66

>>> graphviz.render('dot', 'png', filepath).replace('\\', '/')
'doctest-output/the-holy-hand-grenade.gv.png'
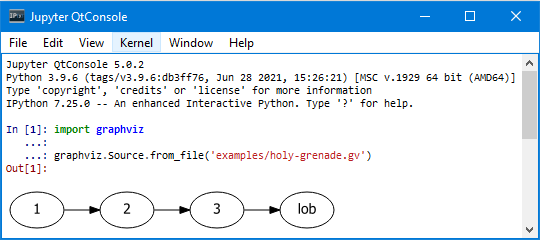
To directly display the rendered visualization of an existing DOT source file
inside a Jupyter notebook
or Qt Console,
you can use graphviz.Source.from_file() (alternative constructor):
Note that render() and view()
on Source instances returned by graphviz.Source.from_file()
skip writing the loaded file back.
The same holds for save().
The instances resolve default .save(skip_existing=None)
to .save(skip_existing_run=True)
to skip writing the read source back into the same file
(specifically the same path that it was loaded from).
Call .save(skip_existing=False) if you want to re-write the loaded source.
Historical note
Before version 0.18 of this library,
Source.save(), Source.render(), and Source.view(),
wrote the content read into source back into the file.
It was advised to use graphviz.render() and graphviz.view()
to directly work on files if the superfluous saving needed to be avoided.
Integration with viewers
On platforms such as Windows, viewer programs opened by render()
with view=True (or equivalently with the view() shortcut-method)
might lock the (PDF, PNG, etc.) file for as long as the viewer is open
(blocking re-rendering it with a Permission denied error).
Tip
You can use the tempfile.mktemp() function
from the stdlib tempfile module to render to a different file
for each invocation. This avoids needing to close the viewer window
each time within such an incremental workflow
(and also serves to preserves the intermediate steps).
>>> import tempfile
>>> import graphviz

>>> g = graphviz.Graph()

>>> g.node('spam')
>>> doctest_mark_exe()  # skip this line

>>> g.view(tempfile.mktemp('.gv'))
'C:\\Users\\User\\AppData\\Local\\Temp\\tmp3aoie8d0.gv.pdf'

>>> g.view(tempfile.mktemp('.gv'))
'C:\\Users\\User\\AppData\\Local\\Temp\\tmphh4ig7a_.gv.pdf'
Other options:
use a viewer that support live updates
use the Jupyter notebook or Qt Console (display the current version of the rendered graph in repeated add/render/view cycles)